Maths Quest is a program designed for students in Year 1 and 2, aged 6 to 8 years old. It is an innovative teaching and learning program, designed for both mainstream and high achieving students, that introduces problem solving concepts in the early primary years.
Comprising a series of activities and tasks that are both interactive and fun, the program encourages students to work together, collaborate and learn from each other.
It comprises two modules per year, with each module focussing on a particular problem solving strategy.
We have included below Part 1 and Part 2 of the Drawing Diagrams Module.
Introducing Drawing Diagrams:Teacher Module Guide
Please watch this video overview of Module 2: Drawing Diagrams.
As students explore and solve maths problems throughout the Focus Lesson and Follow-on Activities, they will be:
- Identifying and depicting essential elements of a problem
- Analysing and visualising relationships between different components of a problem
- Using diagrams as a tool for organising and sequencing information
- Selecting and constructing diagrams to match problem requirements
- Learning about different diagrams and how they are used mathematically
Part 1: Sort the Sets – Teacher Guide
• Analysing and visualising relationships between different components of a problem
PDF Teacher Guide for Part 1: Sort the Sets
Please watch the Teacher Guide Video and download the Teacher Guide Sort the Sets PDF:
Focus Lesson 1: 3 Steps (Week 1)
Step #1 Class Video: Sorting into Sets 5 minutes
This is a 5 minute video that demonstrates how elements can be sorted into sets.
It demonstrates how a Venn diagram has an intersection for elements that belong to both sets.
Two techniques to support students to sort elements into sets are demonstrated.
Class Video: Sorting into Sets
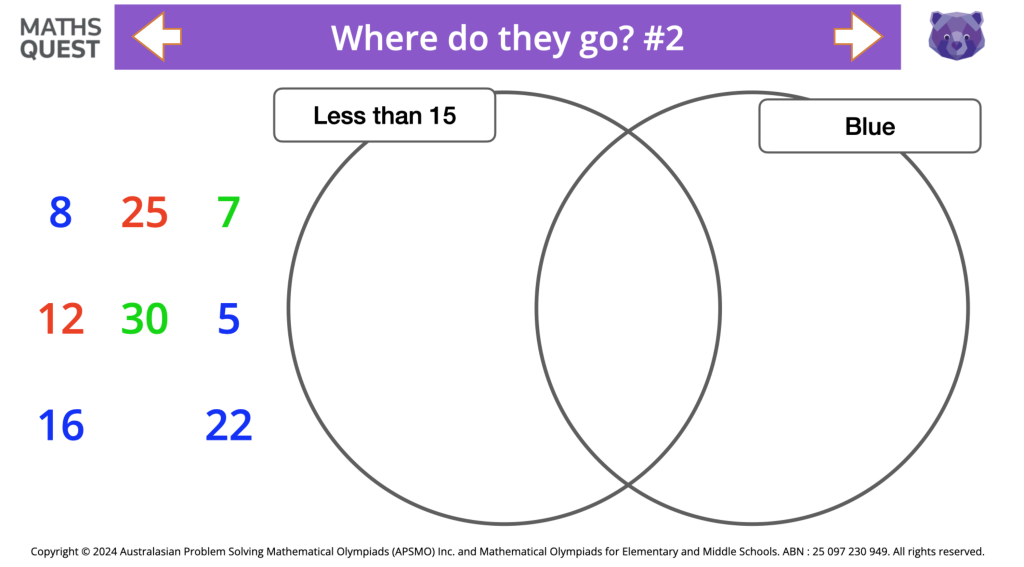
Step #2 Venn diagram Click Through with Student Activity Sheets 10 minutes
There are 3 activities included in this Click Through:
- Where do they go?
- Find the Lost Element, and
- Name the Sets
Click to launch Venn diagrams Click Through (have printed sheets ready to hand out)
Step #3: Differentiated Activity Sheets 20 minutes
There are 2 versions of the Focus Lesson activity sheets.
Version 1 has 2 challenges for each activity and Version 2 has 4 challenges.
Select the appropriate tasks for your students to complete.
Click to download Focus Lesson Activity Sheets Versions 1 & 2
Follow-on Lesson 1: A Selection of 3 Steps (Week 2)
Step 4: Class Video: Introduction to Carroll diagrams 5 minutes
This video introduces Carroll diagrams and demonstrates how they are similar and different to Venn diagrams.
It shows students how they can solve 3 different levels of problems using Sort it Out.
Class Video: Sort it Out
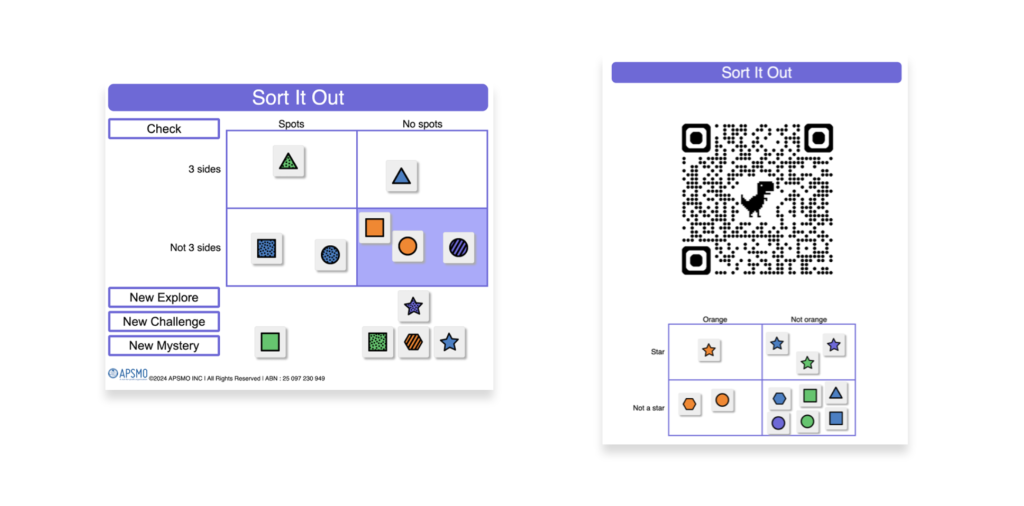
Step #5: Sort it Out Digital Activity 10 minutes
This digital activity lets students generate elements to sort into a Carroll diagram.
Elements will either be numbers or shapes.
Sort the Sets will check the placement of each element and alert students if a change needs to be made.
Sort the Sets can be adjusted for different levels of challenge.
Click below to launch Sort it Out
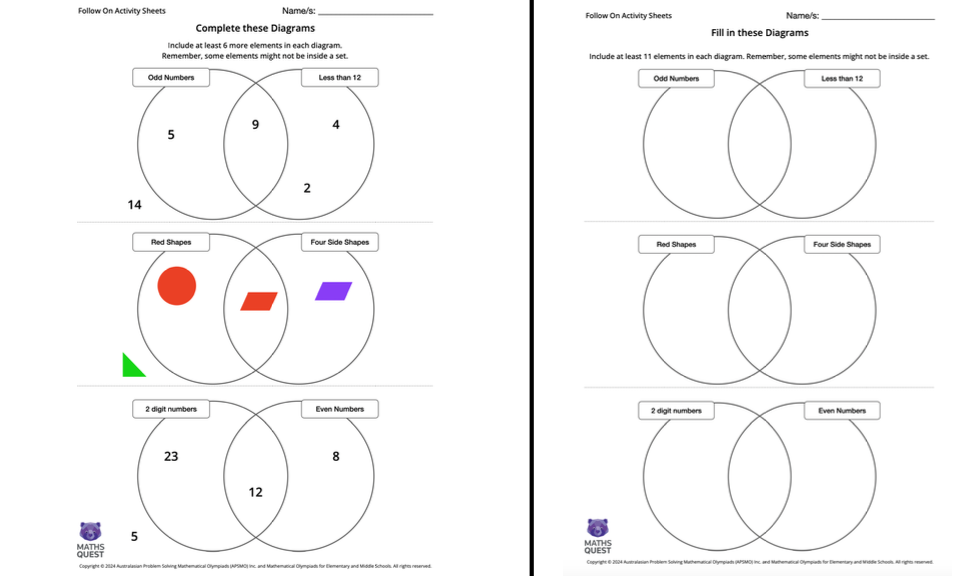
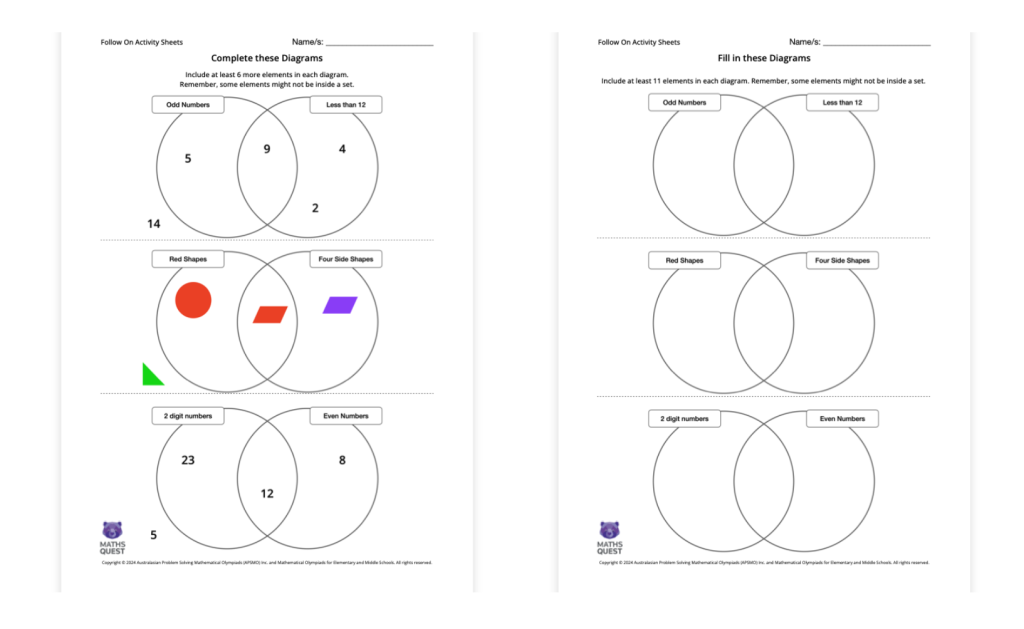
Step #6: Diagrams to Complete (Optional task)
There are 2 versions of this Venn diagram activity for you to select from.
The first version has some elements already placed in the diagram and asks students to add at least 6 more.
The second has empty sets and asks students to add at least 11 elements to the different regions.
Click to download Follow on Activity Sheets
Part 2: Drawing Diagrams – Teacher Guide
- Using diagrams as a tool for organising and sequencing information
- Selecting and constructing diagrams to match problem requirements
PDF Teacher Guide for Part 2: Drawing Diagrams
Please watch the Teacher Guide Video and download the Teacher Guide Drawing Diagrams PDF:
Focus Lesson 2: 3 Steps (Week 3)
Step #1: Class Video: Show the Story 5 minutes
Watch the video through before sharing with your students.
The video demonstrates 4 types of common maths problems that can be solved using diagrams.
Tips and techniques are included to support students as they draw diagrams to show the story.
Class Video Drawing Diagrams to Show the Story
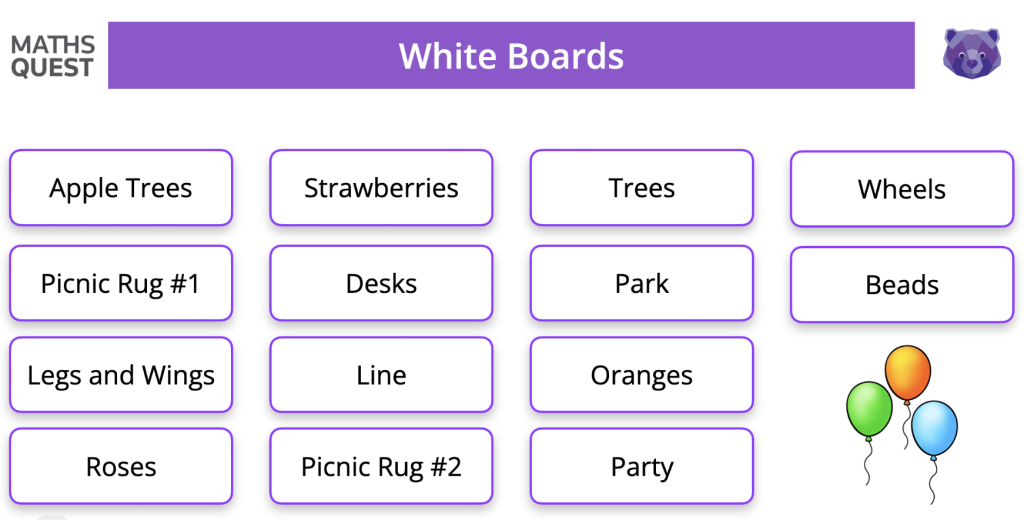
Step #2: Gallery: Show the Story
There are 14 Show the Story problems for students to solve, ranging in difficulty.
Select 3 or 4 to solve together using the gallery, displaying the question on screen and asking students to draw their diagrams on mini white boards.
Share and compare their diagrams.
Look at and discuss solutions included in the Gallery.
Click below to launch the Show the Story Gallery
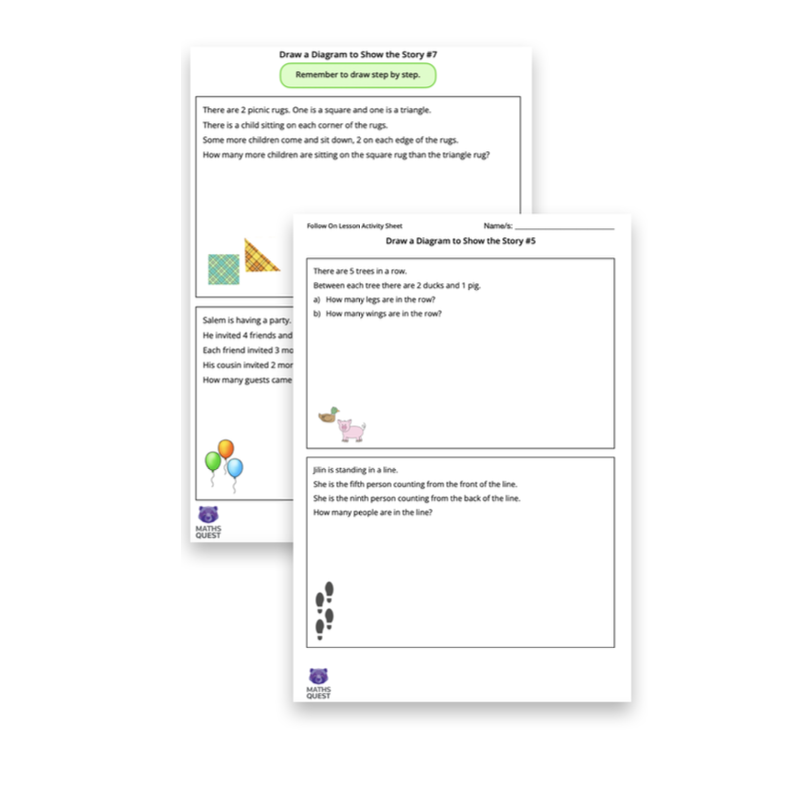
Step #3: Activity Sheets: 20 minutes
Print the activity sheets containing the problems that your class didn’t collectively solve while exploring the Gallery.
Select and distribute activity sheets to your students. They range in their level of complexity.
Encourage students to share with each other their diagrams and see if then have found the same solution.
Click below to download the Show the Story Activity Sheets
Focus Lesson 3: 3 Steps (Week 4)
Step #1: Class Video: Share and Compare 5 minutes
Watch the video through before sharing with your students.
The video demonstrates a diagram that can help students solve comparison maths problems.
Tips and techniques are included to support students as they draw diagrams to share and compare.
Class Video Drawing Diagrams: Share and Compare
Step #2: Gallery: Share and Compare 10 minutes
There are 10 Share and Compare problems for students to solve, ranging in difficulty.
Select 3 or 4 to solve together using the gallery, displaying the question on screen and asking students to draw their diagrams on mini white boards.
Share and compare their diagrams.
Look at and discuss solutions included in the Gallery.
Click below to launch the Share and Compare Gallery
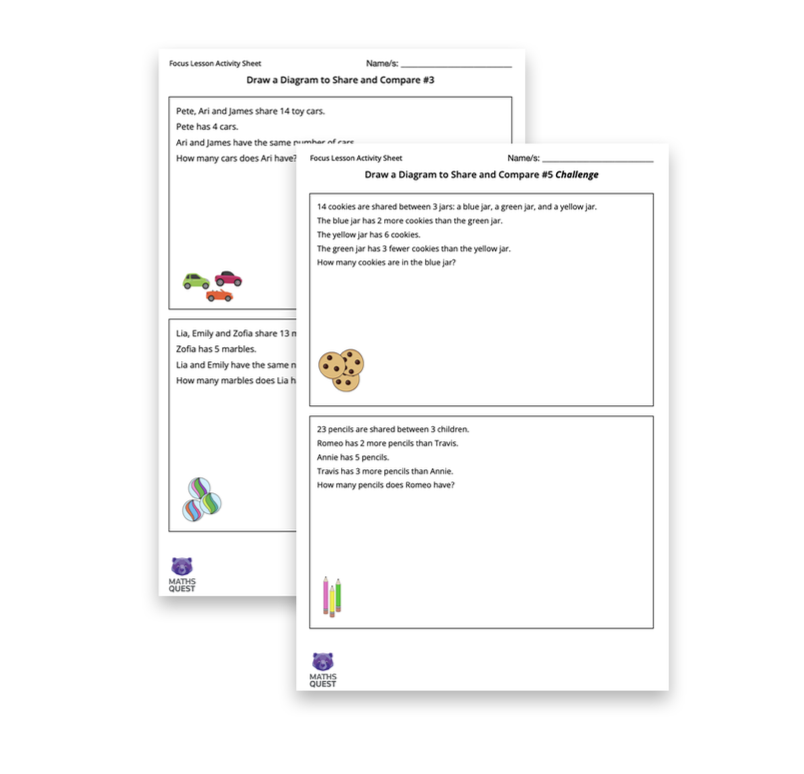
Step #3: Activity Sheets 20 minutes
Print the activity sheets containing the problems that your class didn’t collectively solve while exploring the Gallery.
Select and distribute activity sheets to your students. They range in their level of complexity.
Encourage students to share with each other their diagrams and see if then have found the same solution.
Click below to download the Share and Compare Activity Sheets